3. Using graphs to represent social relations
Social network analysts use two kinds of tools from mathematics to represent information about patterns of ties among social actors: graphs and matrices. On this page, we we will learn enough about graphs to understand how to represent social network data. On the next page, we will look at matrix representations of social relations. With these tools in hand, we can understand most of the things that network analysts do with such data (for example, calculate precise measures of "relative density of ties").
There is a lot more to these topics than we will cover here; mathematics has whole sub-fields devoted to "graph theory" and to "matrix algebra." Social scientists have borrowed just a few things that they find helpful for describing and analyzing patterns of social relations.
A word of warning: there is a lot of specialized terminology here that you do need to learn. its worth the effort, because we can represent some important ideas about social structure in quite simple ways, once the basics have been mastered.
There are lots of different kinds of "graphs." Bar-charts, pie-charts, line and trend charts, and many other things are called graphs and/or graphics. Network analysis uses (primarily) one kind of graphic display that consists of points (or nodes) to represent actors and lines (or edges) to represent ties or relations. When sociologists borrowed this way of graphing things from the mathematicians, they re-named their graphics "socio-grams." Mathematicians know the kind of graphic displays by the names of "directed graphs" "signed graphs" or simply "graphs."
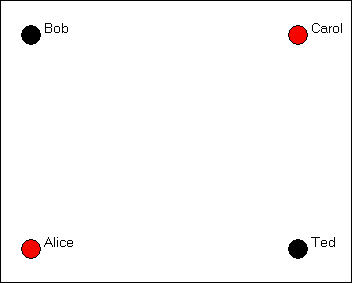
There are a number of variations on the theme of socio-grams, but they all share the common feature of using a labeled circle for each actor in the population we are describing, and line segments between pairs of actors to represent the observation that a tie exists between the two. Let's suppose that we are interested in summarizing who nominates whom as being a "friend" in a group of four people (Bob, Carol, Ted, and Alice). We would begin by representing each actor as a "node" with a label (sometimes notes are represented by labels in circles or boxes). Figure 3.1 shows a graph with four labeled nodes, but no connections.
Figure 3.1. Nodes for a simple graph
In this example, we've also indicated an "attribute" of each actor by coloring the node (black for males, red for females). Coloring, shading, or different shapes and sizes are often used to represent attributes of the individual nodes.
We collected our data about friendship ties by asking each member of the group (privately and confidentially) who they regarded as "close friends" from a list containing each of the other members of the group. Each of the four people could choose none to all three of the others as "close friends." As it turned out, in our (fictitious) case, Bob chose Carol and Ted, but not Alice; Carol chose only Ted; Ted chose Bob and Carol and Alice; and Alice chose only Ted. We would represent this information by drawing an arrow from the chooser to each of the chosen, as in figure 3.2.
Figure 3.2. A directed graph of friendship ties
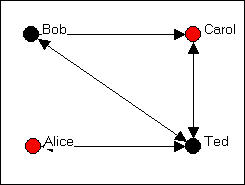
To reduce visual clutter, a double-headed arrow has been used when the relationship between two node is "reciprocated" (i.e. each actor chooses the other).
Let's suppose that we had also taken note of a second kind of relation - whether persons share the relationship "spouse" with one another. In our example, Bob and Carol are spouses, as are Ted and Alice. We can also represent this kind of a "bonded tie" with a directed graph as in figure 3.3.
Figure 3.3. A directed graph of spousal ties
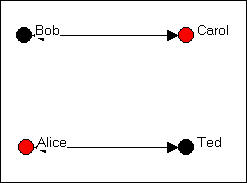
Where a tie is necessarily reciprocated (see the discussion of "bonded ties, below), a "simple" graph is often used instead of a "directed" graph. In a simple graph, relations are simply present of absent, and the relations are indicated by lines without arrow heads.
We can also represent multiple relations (multiplex relations) using graphs -- though with larger numbers of actors or many relations, the results may not be very easy to read. Let's combine the graphs of both "friendship" and "spousal" relations, as in figure 3.4.
Figure 3.4. A directed graph of multiplex relations (friendship and spouse)
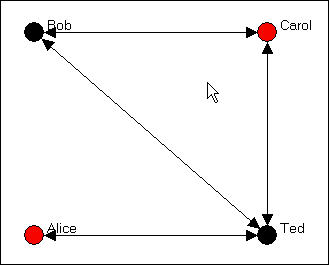
In this figure, a tie is shown between two nodes whenever there is either a friendship tie, or a spousal tie, or both. This helps us to see that Bob, Carol, and Ted form a "clique" (i.e. each is connected to each of the others), and Alice is a "pendant" (tied to the group by only one connection).
This particular way for drawing the multiplex relation, however, loses some information about which ties connect which actors. As an alternative, one might want to superimpose the two single-relation graphs, and show multiple lines (or different color lines, or some dashed lines) to show the different kinds of connections.
Now we need to introduce some terminology to describe different kinds of graphs. Figure 3.2 is an example of a binary (as opposed to a signed or ordinal or valued) and directed (as opposed to a co-occurrence or co-presence or bonded-tie) graph. Figure 3.3 is an example of a "co-occurrence" or "co-presence" or "bonded-tie" graph that is binary and undirected (or simple). The social relations being described here are also simplex (in figures 3.2 and 3.3). Figure 3.4 is an example of one method of representing multiplex relational data with a single graph.
Let's take a moment to review some of this terminology in a little more detail.
In describing the pattern of who describes whom as a close friend, we could have asked our question in several different ways. If we asked each respondent "is this person a close friend or not," we are asking for a binary choice: each person is or is not chosen by each interviewee. Many social relationships can be described this way: the only thing that matters is whether a tie exists or not. When our data are collected this way, we can graph them simply: an arrow represents a choice that was made, no arrow represents the absence of a choice. But, we could have asked the question a second way: "for each person on this list, indicate whether you like, dislike, or don't care." We might assign a + to indicate "liking," zero to indicate "don't care" and - to indicate dislike. This kind of data is called "signed" data. The graph with signed data uses a + on the arrow to indicate a positive choice, a - to indicate a negative choice, and no arrow to indicate neutral or indifferent. Yet another approach would have been to ask: "rank the three people on this list in order of who you like most, next most, and least." This would give us "rank order" or "ordinal" data describing the strength of each friendship choice. Lastly, we could have asked: "on a scale from minus one hundred to plus one hundred - where minus 100 means you hate this person, zero means you feel neutral, and plus 100 means you love this person - how do you feel about...". This would give us information about the value of the strength of each choice on a (supposedly, at least) ratio level of measurement. With either an ordinal or valued graph, we would put the measure of the strength of the relationship on the arrow in the diagram.
In our example, we asked each member of the group to choose which others in the group they regarded as close friends. Each person (ego) then is being asked about ties or relations that they themselves direct toward others (alters). Each alter does not necessarily feel the same way about each tie as ego does: Bob may regard himself as a good friend to Alice, but Alice does not necessarily regard Bob as a good friend. It is very useful to describe many social structures as being composed of "directed" ties (which can be binary, signed, ordered, or valued). Indeed, most social processes involve sequences of directed actions. For example, suppose that person A directs a comment to B, then B directs a comment back to A, and so on. We may not know the order in which actions occurred (i.e. who started the conversation), or we may not care. In this example, we might just want to know that "A and B are having a conversation." In this case, the tie or relation "in conversation with" necessarily involves both actors A and B. Both A and B are "co-present" or "co-occurring" in the relation of "having a conversation." Or, we might also describe the situation as being one of an the social institution of a "conversation" that by definition involves two (or more) actors "bonded" in an interaction (Berkowitz).
"Directed" graphs use the convention of connecting nodes or actors with arrows that have arrow heads, indicating who is directing the tie toward whom. This is what we used in the graphs above, where individuals (egos) were directing choices toward others (alters). "Simple" or "Co-occurrence" or "co-presence" or "bonded-tie" graphs use the convention of connecting the pair of actors involved in the relation with a simple line segment (no arrow head). Be careful here, though. In a directed graph, Bob could choose Ted, and Ted choose Bob. This would be represented by headed arrows going from Bob to Ted, and from Ted to Bob, or by a double-headed arrow. But, this represents a different meaning from a graph that shows Bob and Ted connected by a single line segment without arrow heads. Such a graph would say "there is a relationship called close friend which ties Bob and Ted together." The distinction can be subtle, but it is important in some analyses.
Social actors are often connected by more than one kind of relationship. In our simple example, we showed two graphs of simple (sometimes referred to as "simplex" to differentiate from "multiplex") relations. The friendship graph (figure 3.2) showed a single relation (that happened to be binary and directed). The spouse graph (figure 3.3) showed a single relation (that happened to be binary and un-directed). Figure 3.4 combines information from two relations into a "multiplex" graph.
There are, potentially, different kinds of multiplex graphs. We graphed a tie if there was either a friendship or spousal relation. But, we could have graphed a tie only if there were both a friendship and spousal tie (what would such a graph look like?).
We also combined the information about multiple ties into a single line. Alternatively, one might use different symbols, colors, line widths, or other devices to keep all of the information about multiple relations visible in a multiplex graph -- but the result can often be too complicated to be useful.
A graph (sometimes called a sociogram) is composed of nodes (or actors or points) connected by edges (or relations or ties). A graph may represent a single type of relations among the actors (simplex), or more than one kind of relation (multiplex). Each tie or relation may be directed (i.e. originates with a source actor and reaches a target actor), or it may be a tie that represents co-occurrence, co-presence, or a bonded-tie between the pair of actors. Directed ties are represented with arrows, bonded-tie relations are represented with line segments. Directed ties may be reciprocated (A chooses B and B chooses A); such ties can be represented with a double-headed arrow. The strength of ties among actors in a graph may be nominal or binary (represents presence or absence of a tie); signed (represents a negative tie, a positive tie, or no tie); ordinal (represents whether the tie is the strongest, next strongest, etc.); or valued (measured on an interval or ratio level). In speaking the position of one actor or node in a graph to other actors or nodes in a graph, we may refer to the focal actor as "ego" and the other actors as "alters."
1. What are "nodes" and "edges"? In a sociogram, what is used for nodes? for edges?
2. How do valued, binary, and signed graphs correspond to the "nominal" "ordinal" and "interval" levels of measurement?
3. Distinguish between directed relations or ties and "bonded" relations or ties.
4. How does a reciprocated directed relation differ from a "bonded" relation?
5. Give and example of a multi-plex relation. How can multi-plex relations be represented in graphs?
Application questions
1. Think of the readings from the first part of the course. Did any studies present graphs? If they did, what kinds of graphs were they (that is, what is the technical description of the kind of graph or matrix). Pick one article and show what a graph of its data would look like.
2. Suppose that I was interested in drawing a graph of which large corporations were networked with one another by having the same persons on their boards of directors. Would it make more sense to use "directed" ties, or "bonded" ties for my graph? Can you think of a kind of relation among large corporations that would be better represented with directed ties?
3. Think of some small group of which you are a member (maybe a club, or a set of friends, or people living in the same apartment complex, etc.). What kinds of relations among them might tell us something about the social structures in this population? Try drawing a graph to represent one of the kinds of relations you chose. Can you extend this graph to also describe a second kind of relation? (e.g. one might start with "who likes whom?" and add "who spends a lot of time with whom?").
4. Make graphs of a "star" network, a "line" and a "circle." Think of real world examples of these kinds of structures where the ties are directed and where they are bonded, or undirected. What does a strict hierarchy look like? What does a population that is segregated into two groups look like?