The "power" of a each grid square is calculated as:
Spatial Dynamics of Human Populations: Some Basic Models
Robert A. Hanneman
(robert.hanneman@ucr.edu)
Department of Sociology
University of California, Riverside
Jason Martinez
California State University, San Bernardino
Ray Holguin
College Computing
College of Humanities, Arts, and Social Sciences
University of California, Riverside
2005
Turchin's model of imperial expansion and collapse
The dynamics of the rise and fall of political communities (tribes, chiefdoms, states) has been of continuing interest to researchers across the social sciences (and, of course, outside the social sciences). The historical patterns of change in the domination of rulers over territorial populations are many and varied. In some places, at some times, there are many polities that co-exist (sometimes peacefully, but usually not) in more or less stable configurations for long periods of time. In other places, at other times, huge polities emerge and exert domination over entire world-systems for periods of time -- and then collapse. What can explain these dynamics?
Some analysts emphasize the role of factors internal to individual polities to explain variation in their propensity to seek domination and create empire (Lenin, for example, sees imperialism as a logical outcome to crises of accumulation and legitimation in the polities governing capitalist economies). Weber ties the imperialist urge, in part, to the needs of leaders to legitimate their rule and seek prestige mobility in the world order of polities.
Other analysts emphasize the role of external factors. It is assumed that polities seek domination and expansion, but the patterns produced are the result of complex n-body interactions of warfare and coalition, played out on geographical landscapes that advantage some players over others. Collins and others note that there are limits on the ability of polities to exert force at distances from their centers, and that polities that exceed these limits (as they are wont to do) become fragile and vulnerable. There may be a tendency for polities that emerge in the center of naturally bounded geographical spaces to expand by conquering scattered and small peripheral polities. However, some theorists have suggested that polities at the "marchlands" (outer edges) are likely to be most successful in organizing large polities.
Below we will develop a spatial simulation of one model of imperial expansion and collapse put forward by Peter Turchin (who also reports on experiments with a spatial version of his model in his book). Turchin's model is a formalization inspired by the work of Ibn Khaldun, who emphasized the interaction between the legitimacy of rule (or solidarity of the population with it's political elites) and expansion. Turchin has coupled this internal dynamic of solidarity to the external dynamic of conflict among polities to produce a synthetic formal model with some quite interesting properties that you may wish to explore, and use as a starting point for further elaboration.
page indexPeter Turchin developed a model to describe the dynamics of imperial expansion and contraction in space. Turchin's central
idea is that the growth (and contraction) of empires is largely a
function of the degree of popular support (legitimacy or solidarity
or "patriotism") of the populations in areas of the empire. The
higher the average solidarity, the more capable an empire is of
attacking others, and of defending itself.
Turchin hypothesizes that solidarity levels vary within empires. In
areas near the boundaries of an empire with others, solidarity is
high because of constant threat. However, in areas that are not at
the boundary, the level of solidarity of the population declines. This
insight is borrowed from the great muslim historian, Ibn Khaldun.
The dynamics of the model come from two main sources: changes in the
level of solidarity as a result of expansion and contraction of
empires; and, empires attacking one another when they sense weakness.
Each grid square (spatial area/population) is initialized with two variables:
an imperial index number that indicates which empire a particular
grid square is a member of, and a level of solidarity, or a measure of
support for the empire of which it is a part. Solidarity is a
continuous variable that ranges from zero (meaning no support for the
empire) to one, meaning complete support.
Each grid square also has a level of "power" that is calculated at each
point in time. This "power" is the capacity of a cell to
defend
itself from attack, or to attack a neighbor. The power of each cell
is determined by the size and solidarity of the empire of which it is
a part, and by how far the particular grid square is from
the "center" of the empire. The "center" of each
empire is calculated as the simple mean of the X coordinates and the simple mean
of the Y coordinates of the squares composing the empire. The distance of a grid square from the center
is a part of is our Euclidean distance. That is,
The "power" of a each grid square is calculated as:
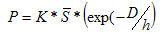
Where K is the number of cells in the empire of which the focal cell is a part, S-bar is the average level of solidarity of the cells that compose the empire. The remaining term shows how the power declines exponentially with the distance of the cell from the center of the empire; the parameter "h" controls the steepness of the exponential function - or the level of the "logistic load" in exerting force at a distance. The greater the value of "h" (which you may select in the simulation), the greater the capacity of the empire to exert force at it's boundary.
In addition to the grid squares and their attributes, the model has a second
set of "agents," which are the empires. Each empire is characterized
by two attributes: the number of cells that the empire
controls, and the average of the solidarity
scores in the cells.
The dynamics of the model come from two sources: changes in the level of
solidarity in each local population depending on it's relationship to the empire
and conflict and conquest between local populations at the edges of adjacent
empires.
The dynamics of the solidarity of each local population (i.e. its level of attachment to the empire of which it is a part) are governed by two rules.
If a grid square is on a boundary, then its solidarity changes
according to the following equation:
![]()
This is a logistic or S-shaped growth. It says that the level of
solidarity increases at some constant rate (r, which you may set as a parameter
in the simulation) times it's current
level, limited by how close it is to the maximum possible value (1). So,
for areas at the boundary between two empires, solidarity increases as a
logistic function of time. The greater the value of r, the more responsive
solidarity is external threat.
If a grid square is not on a boundary, then its solidarity changes
according to a different equation:
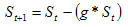
This is a simple exponential decay at the rate "g" which is another
tuneable parameter that you may select in the simulation. The
exponential decay of solidarity at the core of the empire reflects Khaldun's
observation that the center becomes corrupt and self-serving when it is no
longer exposed to direct threat from outsiders.
The other part of the dynamics comes from conflict between empires.
At each point in time, each grid square (chosen in a random order) considers
attacking a randomly chosen one of its four Von Neuman neighbors. If
the chosen neighbor is in the same empire, no attack is made. If the
neighbor is in a different empire, an attack is made. The success of the attack is
determined by the relative power of the two squares, with the more powerful
square winning. The imperial index of the losing square is re-set to
join the empire of the winning region. The solidarity of the
conquered square is set equal to the average of it's own prior
solidarity and the solidarity of the conquering square.
Turchin has includes one final element in imperial dynamics, reflecting the
ecological notion of an "Allee" limit -- a level at which a population
can no longer sustain itself, and will go to extinction. If the average solidarity of an empire falls below
some critical value (which you may select in the simulation) the
empire collapses. That is, all cells within the empire become
independent populations.
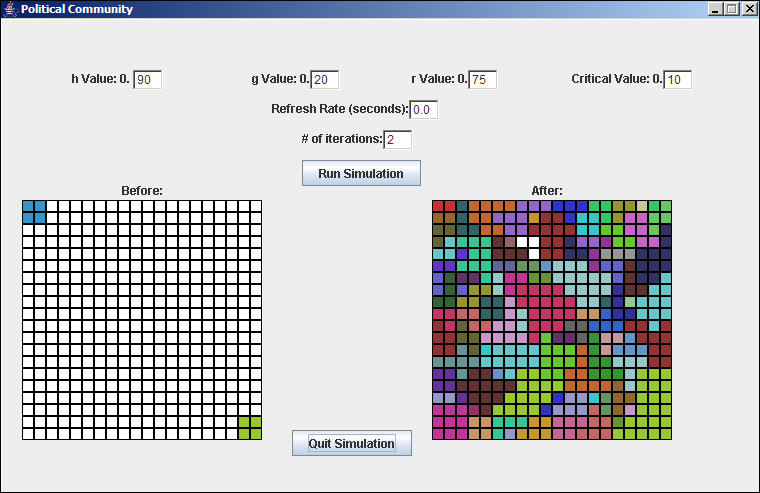
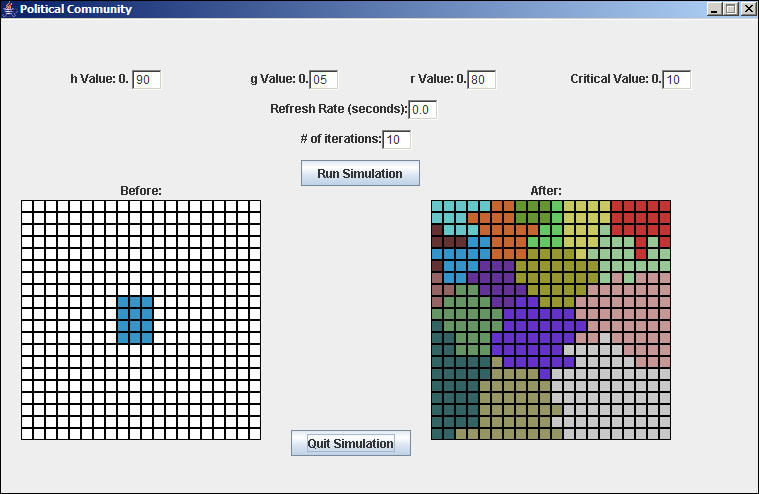
To explore the model, you will need to download a ".jar" file (compiled Java for Windows), as well as the file "cells.txt" that gives the initial configuration. These are provided in the links, below. You may also download these files along with the Java source code so that you can modify the model itself. Figure 1 shows an example of what the interface looks like.
Figure 1. An example of the Turchin political community interface
download the model compiled for Windows (.jar)
to run the compiled model, you need to have the file cells.txt in the same directory.
download a cells.txt file for the bi-polar initial values shown in Figure 1.
In the left panel of the display, the initial configuration (which is generated by the cells.txt file) is shown. Before the simulation is run, the right panel also shows the initial configuration. As the simulation runs, the imperial membership of cells as it changes through conflicts is displayed.
Since we only have 64 colors to work with, many runs will "use up" all of the colors, and re-cycle them. Because of this limitation, you may have to slow down the display and make notes as the simulation develops. The simulation also provides an output file (output.txt) with counts of the number of empires, number created, and number extinguished at each full iteration.
Figure 2. Example of an output data file from the simulation
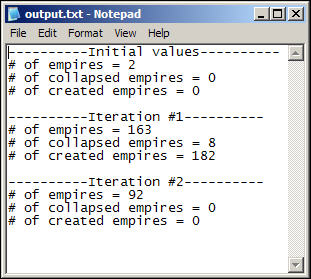
An iteration of the model is defined as a cycle through all the cells of the grid, in random order. For a ten-by-ten grid, there will be 100 possible conflicts and imperial changes evaluated at each iteration. You may select the length of the run of the simulation with the "# of iterations" control.
The Refresh Rate (seconds) control may be used to slow down the animation of the grid. The refresh rate is the length of time taken to display each potential conflict (not each full iteration).
You may also tune the model to explore hypotheses about the effects of:
r = intrinsic growth rate of solidarity at empire boundaries (between zero, meaning no growth of solidarity with time at imperial boundaries; to one, meaning instantaneous increase to maximum solidarity)
g = rate of decline in solidarity for the imperial core (the proportion of solidarity lost per iteration in cells that are not at the imperial boundary)
h = rate at the ability to deliver force at the imperial boundary declines with distance from the center (where values near zero indicate high friction, or high logistic loads and values near one indicate low friction or low logistic loads)
Critical value = average level of solidarity within an empire, below which complete dissolution of an empire occurs.
page indexFour parameters are provided in the interface for your experimentation. Try to deduce what the effects of these parameters ought to be, and test your deductions using the simulation:
In our simulation, we apply the same parameters to all cells. You might want to explore the effects of assigning parameters drawn from some distribution, rather than constants.
Heartland and marchland scenario
One controversy in the research on imperial growth and collapse is whether empires located in the center, or at the periphery ("marchland") of a spatial area are more or less successful. Most of the great civilizations have been driven by empires that were "centered" and had, as a result, shorter lines of communication with larger areas than empires centered at the periphery. On the other hand, empires at the periphery face enemies on fewer sides, and have shorter borders to protect than centered empires.
To very briefly explore this question, we will generate two simulations (serious research would generate many replications of each). In Figure 3, we have run a model with a fairly large (4 by 3) empire originating in the center of an otherwise unorganized space. In Figure 4, we run a model with an equal sized empire originating in the middle of one edge. Both simulations are run for 10 iterations.
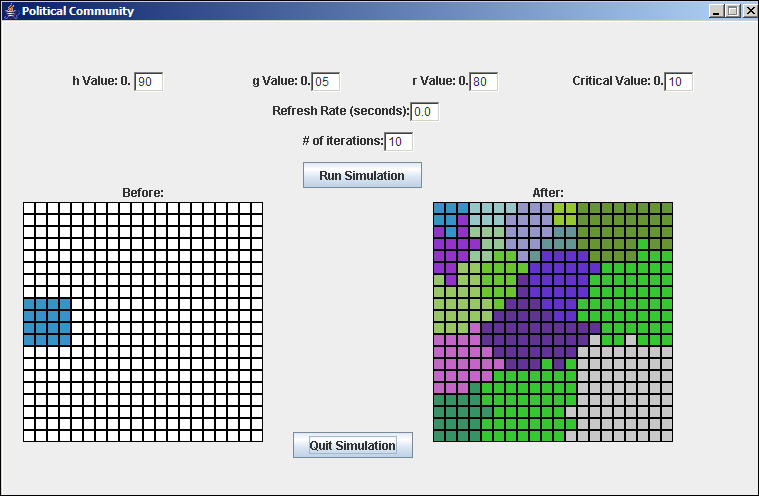
Figure 3. Initial empire located at spatial center
In this run, the central empire survives, but does not expand. Over time, it is displaced from the center of the grid and migrates toward the northeast. The remaining space is organized into a fairly large number of fairly similarly-sized polities.
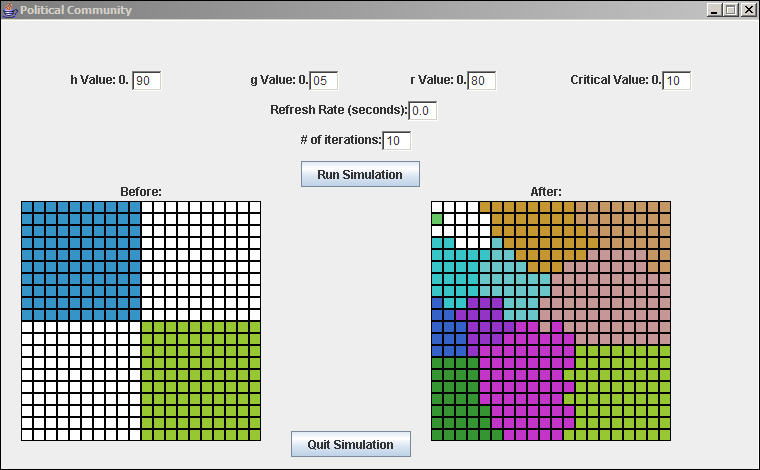
Figure 4. Initial empire located in the "marchland"
In this scenario, the original empire also survives, but does not grow. Over time, it too is displaced from it's original homeland and migrates (to the NW corner). The remaining space is organized into a somewhat smaller number of polities that display somewhat greater variation in size.
We offer no conclusion here on the theoretical question of the value of central or peripheral location. But there are many variations that you might want to explore -- and perhaps you will find a clear pattern of results!
Suppose that our initial situation was one of two equally large polities, and some un-organized "buffer" lands. How might the political organization evolve? Figure 5 shows a single run of such a scenario.
Figure 5. Bi-polar scenario simulation
In this case, one of the original hegemonic states has collapsed, and the other has been slightly circumscribed by the growth of rather large communities in the originally un-organized buffer lands. Why might one hegemonic state collapse, but not the other? Why are the buffer zone polities large, rather than small and fragmented?
page indexThe model of the spatial dynamics of political communities developed here is extremely simple, when compared to the complexities of the historical record. One major limitation of the current model is that it takes no account of the differing "carrying capacities" of spatial areas to support dense and complex human organizational forms. That is, the real "polity game" is played on a board of "rich" and "poor" squares.
The model, however, does put forward a theory of how the dynamics of rule within polities interact with the dynamics between polities. Most more formal theories of the dynamics of political communities, to date, focus on either internal or external dynamics. So, the model here is a step forward. We hope that others will modify and extend the theory.
In the meantime, there is a great deal to learn about the dynamic tendencies of differing initial conditions, and different parameter values of the model presented here. Are there equilibriums? What initial conditions and parameters produce stability or continuing change? If there are equilibriums, how long does it take to achieve them? Do the initial conditions and parameter values affect the hazard rates of empire foundation and failure? What are the consequences of initial conditions and parametric settings for the size distributions of empires?
The historical record of the dynamics of polities contains many cases, but fully understanding the implications of general theories will require simulation experiments.
page index