11. Cliques and sub-groups
One of the most common interests of structural analysts is in the "sub-structures" that may be present in a network. The dyads, triads, and ego-centered neighborhoods that we examined earlier can all be thought of as sub-structures. In this chapter, we'll consider some approaches to identifying larger groupings.
Many of the approaches to understanding the structure of a network emphasize how dense connections are built-up from simpler dyads and triads to more extended dense clusters such as "cliques." This view of social structure focuses attention on how solidarity and connection of large social structures can be built up out of small and tight components: a sort of "bottom up" approach. Network analysts have developed a number of useful definitions an algorithms that identify how larger structures are compounded from smaller ones: cliques, n-cliques, n-clans, and k-plexes all look at networks this way.
Divisions of actors into groups and sub-structures can be a very important aspect of social structure. It can be important in understanding how the network as a whole is likely to behave. Suppose the actors in one network form two non-overlapping groups; and, suppose that the actors in another network also form two groups, but that the memberships overlap (some people are members of both groups). Where the groups overlap, we might expect that conflict between them is less likely than when the groups don't overlap. Where the groups overlap, mobilization and diffusion may spread rapidly across the entire network; where the groups don't overlap, traits may occur in one group and not diffuse to the other.
Knowing how an individual is embedded in the structure of groups within a net may also be critical to understanding his/her behavior. For example, some people may act as "bridges" between groups (cosmopolitans, boundary spanners, or "brokers" that we examined earlier). Others may have all of their relationships within a single group (locals or insiders). Some actors may be part of a tightly connected and closed elite, while others are completely isolated from this group. Such differences in the ways that individuals are embedded in the structure of groups within in a network can have profound consequences for the ways that these actors see their "society," and the behaviors that they are likely to practice.
We can also look for sub-structure from the "top-down." Looking at the whole network, we can think of sub-structures as areas of the graph that seem to be locally dense, but separated to some degree, from the rest of the graph. This idea has been applied in a number of ways: components, blocks/cutpoints, K-cores, Lambda sets and bridges, factions, and f-groups will be discussed here.
The idea that some regions of a graph may less connected to the whole than others may lead to insights into lines of cleavage and division. Weaker parts in the "social fabric" also create opportunities for brokerage and less constrained action. So, the numbers and sizes of regions, and their "connection topology" may be consequential for predicting both the opportunities and constraints facing groups and actors, as well as predicting the evolution of the graph itself.
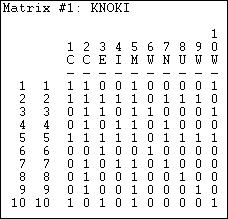
Most computer algorithms for locating sub-structures operate on binary symmetric data. We will use the Knoke information exchange data for most of the illustrations again in this chapter. Where algorithms allow it, the directed form of the data will be used. Where symmetric data are called for, we will analyze "strong ties." That is, we will symmetrize the data by insisting that ties must be reciprocated in order to count; that is, a tie only exists if xy and yx are both present.
The resulting reciprocity-symmetric data matrix is shown in figure 11.1
Figure 11.1 Knoke information network symmetrized with reciprocated ties
Insisting that information move in both directions between the parties in order for the two parties to be regarded as "close" makes theoretical sense, and substantially lessens the density of the matrix. Matrices that have very high density, almost by definition, are likely to have few distinctive sub-groups or cliques. It might help to graph these data as in figure 11.2.
Figure 11.2 Graph of Knoke information strong symmetric ties
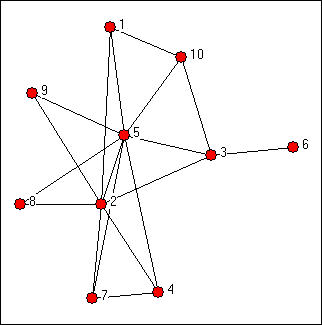
The diagram suggests a number of things. Actors #5 and #2 appear to be in the middle of the action -- in the sense that they are members of many of the groupings, and serve to connect them, by co-membership. The connection of sub-graphs by actors can be an important feature. We can also se that there is one case (#6) that is not a member of any sub-group (other than a dyad). If you look closely, you will see that dyads and triads are the most common sub-graphs here -- and despite the substantial connectivity of the graph, tight groupings larger than this seem to be few. It is also apparent from visual inspection that most of the sub-groupings are connected -- that groups overlap.
Answers to the main questions about a graph, in terms of its sub-structures, may be apparent from inspection:
The formal tools and concepts of sub-graph structure help to more rigorously define ideas like this. Various algorithms can then be applied to locate, list, and study sub-graph features. Obviously, there are a number of possible groupings and positions in sub-structures, depending on our definitions. Below, we will look at the most common of these ideas.
In a sense, all networks are composed of groups (or sub-graphs). When two actors have a tie, they form a "group." One approach to thinking about the group structure of a network begins with this most basic group, and seeks to see how far this kind of close relationship can be extended. This is a useful way of thinking, because sometimes more complex social structures evolve, or emerge, from very simple ones.
A clique extends the dyad by adding to it members who are tied to all of the members in the group. This strict definition can be relaxed to include additional nodes that are not quite so tightly tied (n-cliques, n-clans, and k-plexes). The notion, however, it to build outward from single ties to "construct" the network. A map of the whole network can be built up by examine the sizes of the various cliques and clique-like groupings, and noting their size and overlaps.
These kinds of approaches to thinking about the sub-structures of networks tend to emphasize how the macro might
emerge out of the micro. They tend to focus our attention on individuals first, and try to understand how they
are embedded in the web of overlapping groups in the larger structure. I make a point of these seemingly obvious
ideas because it is also possible to approach the question of the sub-structure of networks from the top-down.
Usually, both approaches are worthwhile and complementary. We will turn our attention first to "bottom-up"
thinking.
table of contents
The idea of a clique is relatively simple. At the most general level, a clique is a sub-set of a network in which the actors are more closely and intensely tied to one another than they are to other members of the network. In terms of friendship ties, for example, it is not unusual for people in human groups to form "cliques" on the basis of age, gender, race, ethnicity, religion/ideology, and many other things. The smallest "cliques" are composed of two actors: the dyad. But dyads can be "extended" to become more and more inclusive -- forming strong or closely connected regions in graphs. A number of approaches to finding groups in graphs can be developed by extending the close-coupling of dyads to larger structures.
The formal definition of a "clique" as it is used in network analysis is much more narrow and precise than the general notion of a high local density. Formally, a clique is the maximum number of actors who have all possible ties present among themselves. A "Maximal complete sub-graph" is such a grouping, expanded to include as many actors as possible. The UCINET algorithm Network>Subgroups>Cliques produces a census of all cliques, and some useful additional analysis. The result, applied to our symmetrized Knoke information matrix is shown in figures 11.3 through 11.6.
Figure 11.3. Clique and actor-by-clique analysis of reciprocity-symmetrized Knoke information network
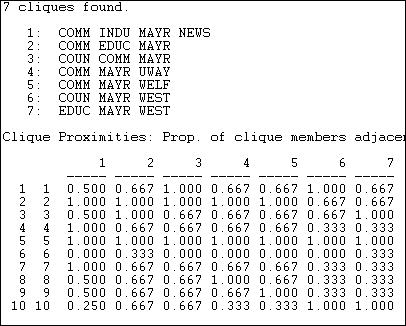
There are seven maximal complete sub-graphs present in these data (see if you can find them in figure 11.2). The largest one is composed of four of the ten actors, and all of the other smaller cliques share some overlap with some part of the largest clique. The second panel shows how "adjacent" each actor (row) is to each clique (column). Actor 1, for example, is adjacent to 2/3 of the members of clique 5. There is a very high degree of common membership in these data.
We might be interested in the extent to which these sub-structures overlap, and which actors are most "central" and most "isolated" from the cliques. We can examine these questions by looking at "co-membership."
Figure 11.4. Actor-by-actor analysis of reciprocity-symmetrized Knoke information network
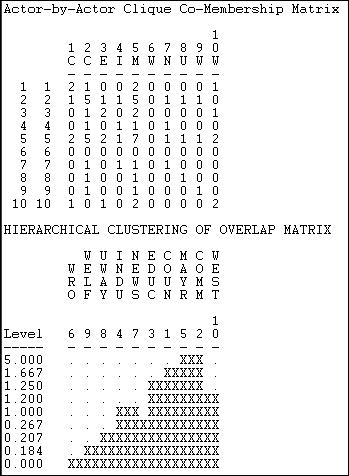
The first panel here shows how many cliques each pair of actors are both members of. It is immediately apparent that actor #6 is a complete isolate, and that actors #2 and #5 overlap with almost all other actors in at least one clique. We see that actors #2 and #5 are "closest" in the sense of sharing membership in five of the seven cliques. We can take this kind of analysis one step further by using single linkage agglomerative cluster analysis to create a "joining sequence" based on how many clique memberships actors have in common. This is shown in the second panel of figure 11.4. We see that actors 2 and 5 are "joined" first as being close because they share 5 clique memberships in common.
Moving to still a higher level, we can look at the extent to which the cliques overlap with one another, as measured by the numbers of members in common, as in figure 11.5.
Figure 11.5. Clique-by-clique analysis of reciprocity-symmetrized Knoke information network
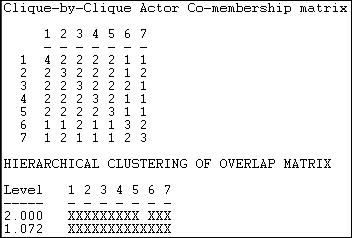
A cluster analysis of the closeness of the cliques shows that cliques 6 and 7 are (a little) separate from the other cliques.
You might note that the (rather lengthy) output again points to the multi-level nature of network analysis. We can see actors related to actors to define groups; we can see actors related to groups; and we can see groups related to groups in this analysis of the clique structure.
Insisting that every member of a clique be connected to every other member is a very strong definition of what we mean by a group. There are a number of ways in which this restriction could we relaxed. Two major approaches are the N-clique/N-clan approach and the k-plex approach.
The strict clique definition (maximal fully-connected sub-graph) may be too strong for many purposes. It insists that every member or a sub-group have a direct tie with each and every other member. You can probably think of cases of "cliques" where at least some members are not so tightly or closely connected. There are two major ways that the "clique" definition has been "relaxed" to try to make it more helpful and general.
One alternative is to define an actor as a member of a clique if they are connected to every other member of the group at a distance greater than one. Usually, the path distance two is used. This corresponds to being "a friend of a friend." This approach to defining sub-structures is called N-clique, where N stands for the length of the path allowed to make a connection to all other members. Network>Subgroups>N-Cliques finds these sub-structures and performs over-lap analysis. Figure 11.6 shows the census of N-cliques for N=2.
Figure 11.6. N-cliques of reciprocity-symmetrized Knoke information network (N=2)
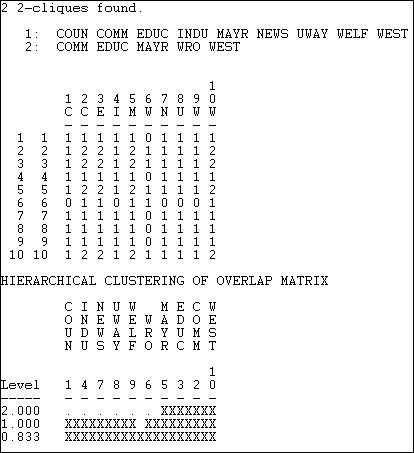
The cliques that we saw before have been made more inclusive by the relaxed definition of group membership. The first n-clique includes everyone but actor #6. The second is more restricted, and includes #6 (WRO), along with two elements of the core. Because our definition of how closely linked actors must be to be members of a clique has been relaxed, there are fewer maximal cliques. With larger and fewer sub-groups, the mayor (#5) no longer appears to be quite so critical. With the more relaxed definition, there is now an "inner circle" of actors that are members of both larger groupings. This can be seen in the co-membership matrix, and by clustering.
The N-clique approach tends to find long and stringy groupings rather than the tight and discrete ones of the maximal approach. In some cases, N-cliques can be found that have a property that is probably undesirable for many purposes: it is possible for members of N-cliques to be connected by actors who are not, themselves, members of the clique. For most sociological applications, this is quite troublesome.
To overcome this problem, some analysts have suggested restricting N-cliques by insisting that the total span or path distance between any two members of an N-clique also satisfy a condition. The additional restriction has the effect of forcing all ties among members of an n-clique to occur by way of other members of the n-clique. This is the n-clan approach. Network>Subgroups>N-Clan can be used to produce a clique analysis using the N-clan rule. For the Knoke information matrix, as symmetrized here, the result is identical to the N-clique approach.
The n-clique and n-clan approaches provide an alternative to the stricter "clique" definition, and this more relaxed approach often makes good sense with sociological data. In essence, the n-clique approach allows an actor to be a member of a clique even if they do not have ties to all other clique members; just so long as they do have ties to some member, and are no further away than n steps (usually 2) from all members of the clique. The n-clan approach is a relatively minor modification on the n-clique approach that requires that the all the ties among actors occur through other members of the group.
If one is uncomfortable with regarding the friend of a clique member as also being a member of the clique (the n-clique approach), one might consider an alternative way of relaxing the strict assumptions of the clique definition -- the K-plex approach.
An alternative way of relaxing the strong assumptions of the "Maximal Complete Sub-Graph" is to allow that actors may be members of a clique even if they have ties to all but k other members. For example, if A has ties with B and C, but not D; while both B and C have ties with D, all four actors could fall in clique under the K-Plex approach. This approach says that a node is a member of a clique of size n if it has direct ties to n-k members of that clique.
The k-plex approach would seem to have quite a bit in common with the n-clique approach, but k-plex analysis often gives quite a different picture of the sub-structures of a graph. Rather than the large and "stringy" groupings sometimes produced by n-clique analysis, k-plex analysis tends to find relatively large numbers of smaller groupings. This tends to focus attention on overlaps and co-presence (centralization) more than solidarity and reach.
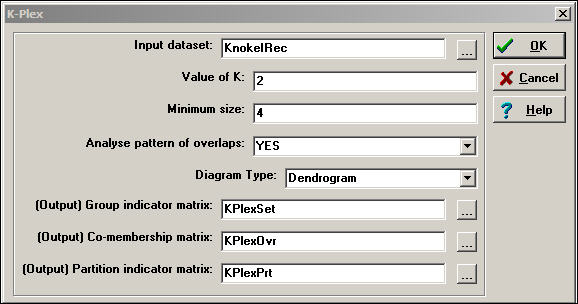
In our example, below, we have allowed k to be equal to two, but insisted that a K-plex grouping include at least four members. That is, an actor is considered to be a member of a clique if that actor has ties to all but two others (at a minimum, half) in that clique. Figure 11.7 shows the dialog of Network>Subgroups>K-Plex that specifies our definition.
Figure 11.7 Dialog of Network>Subgroups>K-Plex for groups of at least four with k=2
The results of the K-Plex analysis are shown in figure 11.8.
Figure 11.8. Analysis of K-Plex groups in Knoke reciprocity-symmetrized information network
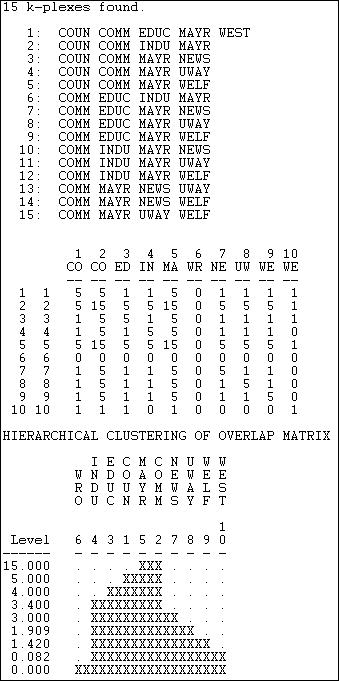
The COMM is present in every k-component; the MAYR is present in all but one. Clearly these two actors are "central" in the sense of playing a bridging role among multiple slightly different social circles. Again we note that organization #6 (WRO) is not a member of any K-plex clique. The K-plex method of defining cliques tends to find "overlapping social circles" when compared to the maximal or N-clique method.
The k-plex approach to defining sub-structures makes a good deal of sense for many problems. It requires that members of a group have ties to (most) other group members -- ties by way of intermediaries (like the n-clique approach) do not quality a node for membership. The picture of group structure that emerges from k-plex approaches can be rather different from that of n-clique analysis. Again, it is not that one is "right" and the other "wrong." Depending on the goals of the analysis, both can yield valuable insights into the sub-structure of groups.
A k-core is a maximal group of actors, all of whom are connected to some number (k) of other members of the group. To be included in a k-plex, an actor must be tied to all but k other actors in the group. The k-core approach is more relaxed, allowing actors to join the group if they are connected to k members, regardless of how many other members they may not be connected to. By varying the value of k (that is, how many members of the group do you have to be connected to), different pictures can emerge. K-cores can be (and usually are) more inclusive than k-plexes. And, as k becomes smaller, group sizes will increase.
NetDraw includes a tool for identifying and coloring a graph according to its K-cores. The UCINET algorithm for identifying K-cores is located at Network>Regions>K-Core.
In our example data, if we require that each member of a group have ties to 3 other members (a 3-core), a rather large central group of actors is identified {1,2,3,4,5,7,10}. Each of the seven members of this core has ties to at least three others. If we relax the criterion to require only two ties, actors 8 and 9 are added to the group (and 6 remains an isolate). If we require only one tie (really, the same thing as a component), all actors are connected.
The k-core definition is intuitively appealing for some applications. If an actor has ties to a sufficient number
of members of a group, they may feel tied to that group -- even if they don't know many, or even most members.
It may be that identity depends on connection, rather than on immersion in a sub-group.
table of contents
All of the approaches we've examined so far deal with binary (and usually symmetric) relations. If we have information on the strength, cost, or probability of relations, we might also want to apply "bottom-up" thinking to find maximal groups. One approach would be to simply dichotomize the data (maybe at several different cut-points). Network>Subgroups>f-Groups is an algorithm that builds on this idea, and combines it with the notion that larger groups are composed of triadic relations.
F-groups identifies maximal groups made up of "strongly transitive" and "weakly transitive" triads. A strong tie triad is formed when, if there is a tie XY and a tie YZ, there is also a tie XZ that is equal in value to the XY and YZ ties. A weakly transitive triad is formed if the ties XY and YZ are both stronger than the tie XZ, but the tie XZ is greater than some cut-off value.
Network>Subgroups>f-Groups takes the value of a strong tie to be equal to the largest valued tie in a graph. The user selects the cut-off value for what constitutes a weak tie.
Figure 11.9 shows the results of using this algorithm to identify strong and weak groups among the top 100 donors to California political campaigns. The value of the relation in these data is the number of campaigns to which donors both contributed. We have set our cut-off for a "weak tie" to be three campaigns in common.
Figure 11.9. F-groups among California political donors (truncated)
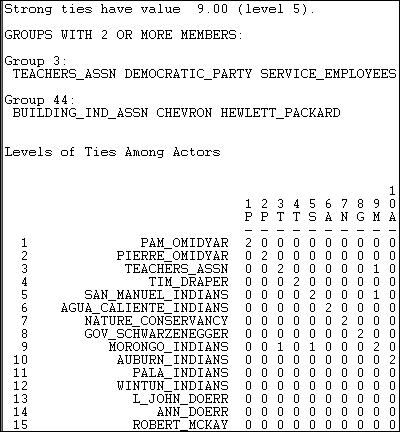
There happen to be two f-groups in these data. One is composed of strongly transitive ties, and is moderately large (seven members). "Group 3" (meaning that the first member of this group is node 3, the California Teacher's Association) contains a number of actors among whom all ties have the value 9 (the highest value in the graph). The members are listed in the top part of the output; the bottom part of the output shows the same result in matrix form, with "1" indicating co-presence in a weak component, and "2" indicating co-presence in a strongly transitive component. Our second component is a weakly transitive one, composed of the Building Industry Association and two large corporations (Chevron Oil and Hewlett-Packard). This is a grouping in which all the ties satisfy the criteria of weak transitivity.
The approaches we've examined to this point start with the dyad, and see if this kind of tight structure can be extended outward. Overall structure of the network is seen as "emerging" from overlaps and couplings of smaller components. Certainly, this is a valid way of thinking about large structures and their component parts. The bottom-up approach may focus our attention on the underlying dynamic processes by which actor build networks.
Some might prefer, however, to start with the entire network as their frame of reference, rather than the dyad. Approaches of this type tend to look at the "whole" structure, and identify "sub-structures" as parts that are locally denser than the field as a whole. In a sense, this more macro lens is looking for "holes" or "vulnerabilities" or "weak spots" in the overall structure or solidarity of the network. These holes or weak spots define lines of division or cleavage in the larger group, and point to how it might be de-composed into smaller units. This top-down perspective leads us to think of dynamics that operate at the level of group-selection, and to focus on the constraints under which actors construct networks.
There are numerous ways that one might define the divisions and "weak spots" in a network. Below are some of the most common approaches.
Components of a graph are sub-graphs that are connected within, but disconnected between sub-graphs. If a graph contains one or more "isolates," these actors are components. More interesting components are those which divide the network into separate parts, and where each part has several actors who are connected to one another (we pay no attention to how closely connected).
For directed graphs (in contrast to simple graphs), we can define two different kinds of components. A weak component is a set of nodes that are connected, regardless of the direction of ties. A strong component requires that there be a directed path from A to B in order for the two to be in the same component.
Since the Knoke information network has a single component, it isn't very interesting as an example. Let's look instead at the network of large donors to California political campaigns, where the strength of the relation between two actors is defined by the number of times that they contributed on the same side of an issue.
UCINET provides two algorithms for doing a census of components. Network>Regions>Components> Simple graphs is used for binary data. In addition to identifying the members of the components, it calculates a number of statistical measures of graph fragmentation. Network>Regions>Components>Valued Graphs can be used to examine the hierarchy of components as the cut-off value of tie strength is increasingly relaxed. Figure 11.10 shows partial results for the California political donations data.
Figure 11.10. Weak component hierarchy for California political donors (truncated)
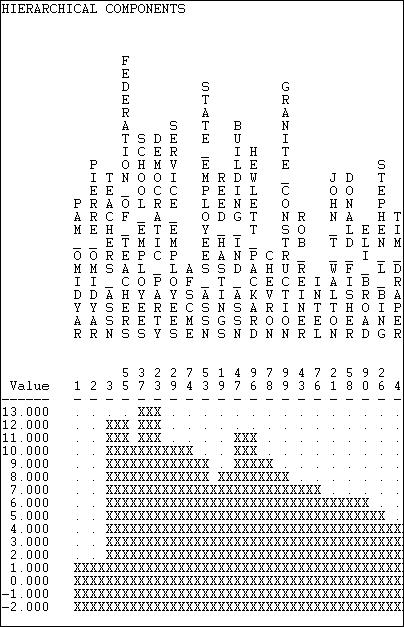
If we set a very high cut-off value of 13 issues in common, then our graph has only non-isolate component (made up of the Democratic Party and the School Employees union). Progressively lower cut-offs produce multiple, separate components until we reach a value of 7 issues in common. At this point, the non-isolated nodes all become connected into a single component.
Rather as the strict definition of a "clique" may be
too strong to capture the meaning of the concept of a maximal group, the notion of a component
may be too strong to find all the meaningful weak-points, holes, and locally dense sub-parts of a larger graph. So, we will examine some more flexible
approaches.
table of contents
An alternative approach to finding the key "weak" spots in the graph is to ask: if a node were removed, would the structure become divided into un-connected parts? If there are such nodes, they are called "cutpoints." And, one can imagine that such cutpoints may be particularly important actors -- who may act as brokers among otherwise disconnected groups. The divisions into which cut-points divide a graph are called blocks. We can find the maximal non-separable sub-graphs (blocks) of a graph by locating the cutpoints. That is, we try to find the nodes that connects the graph (if there are any). Another name for a block is a "bi-component."
The UCINET algorithm Network>Regions>Bi-Component locates and identifies blocks and cut-points. In Figure 11.11, we've applied it to the original Knoke symmetrized reciprocity data.
Figure 11.11. Cutpoints and blocks in the Knoke information network
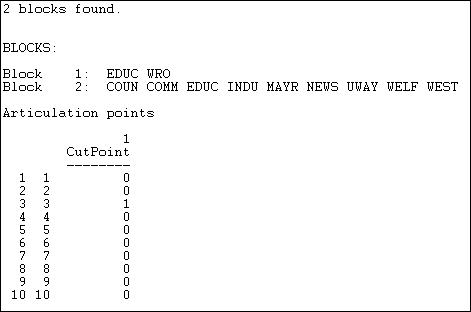
Two blocks are identified, with EDUC a member of both. This means that if EDUC (node 3) were removed, the WRO would become isolated. Node 3, then, is a cut-point. You might want to verify this by eye, by glancing back at the graph of this network.
Components analysis locates parts of the graph that are disconnected; bi-components analysis locates parts that are vulnerable. Both approaches focus attention on key actors.
An alternative approach is to ask if there are certain connections in the graph which, if removed, would result in a disconnected structure. In our example, the only relationship that qualifies is that between EDUC and WRO. But, since this would only lop-off one actor, rather than really altering the network, it is not very interesting. However, it is possible to approach the question in a more sophisticated way. The Lambda set approach ranks each of the relationships in the network in terms of importance by evaluating how much of the flow among actors in the net go through each link. It then identifies sets of relationships which, if disconnected, would most greatly disrupt the flow among all of the actors. The math and computation is rather extreme, though the idea is fairly simple.
Network>Subgroups>Lambda Set locates the vulnerable "bridges" between pairs of actors. Figure 11.12 shows the results for the Knoke (reciprocity-symmetrized) information network.
Figure 11.12. Lambda sets in the Knoke information network
LAMBDA SETS

HIERARCHICAL LAMBDA SET PARTITIONS

           U W C E I M C N W
         W W E O D N A O E E
         R A L U U D Y M W S
         O Y F N C U R M S T

                           1
Lambda   6 8 9 1 3 4 5 2 7 0
------   - - - - - - - - - -
     7   . . . . . . XXX . .
     3   . . . XXXXXXXXXXXXX
     2   . XXXXXXXXXXXXXXXXX
     1   XXXXXXXXXXXXXXXXXXX
This approach identifies the #2 to #5 (MAYR to COMM) linkage as the most important one in the graph - in the sense that it carries a great deal of traffic, and the graph would be most disrupted if it were removed. This result can be confirmed by looking at the graph, where we see that most actors are connected to most other actors by way of the linkage between #2 and #5. Considerably less critical are linkages between 2 and 5 and actors 1, 3, 4, 7, and 10. Again, a glance at the figure shows these organizations to be a sort of "outer circle" around the core.
The lambda set idea has moved us quite far away from the strict components idea. Rather than emphasizing the "decomposition" or separation of the structure into un-connected components, the lambda set idea is a more "continuous" one. It highlights points at which the fabric of connection is most vulnerable to disruption.
Imagine a society in which each person was closely tied to all others in their own sub-population (that is, all sub-populations are cliques), and there are no connections at all among sub-populations (that is, each sub-population is a component). Most real populations do not look like this, but the "ideal type" of complete connection within and complete disconnection between sub-groups is a useful reference point for assessing the degree of "factionalization" in a population.
If we took all the members of each "faction" in this ideal-typical society, and put their rows and columns together in an adjacency matrix (i.e. permuted the matrix), we would see a distinctive pattern of "1-blocks" and "0-blocks." All connections among actors within a faction would be present, all connections between actors in different factions would be absent.
Network>Subgroups>Factions is an algorithm that finds the optimal arrangement of actors into factions to maximize similarity to the ideal type, and measures how well the data actually fit the ideal type. Figure 11.13 shows the dialog for using this tool.
Figure 11.13. Dialog for Network>Subgroups>Factions
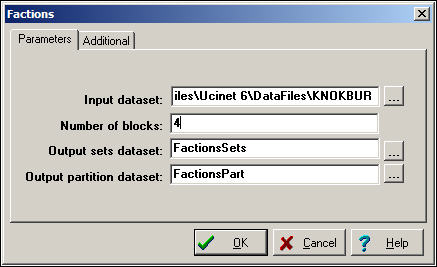
Notice that you must specify how many factions (blocks) you would like the algorithm to find. If you have a prior hypothesis that a given population was divided into two factions, you could "test" this hypothesis by seeing how much error remained after defining two optimal factions. More commonly, we might use this tool in an exploratory way, examining the results from several runs with differing numbers of factions. As with any exploratory technique, it is a matter of judgment which solution is most helpful. After running several alternative numbers of blocks, we settled on four as meaningful for our purposes. This result is shown in figure 11.14.
Figure 11.14. Four-faction solution for the directed Knoke information network
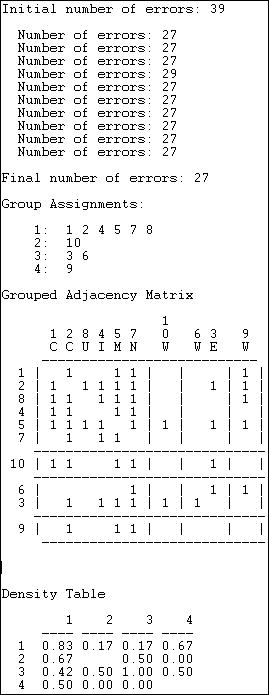
The "Final number of errors" can be used as a measure of the "goodness of fit" of the "blocking" of the matrix. This count (27 in this case) is the sum of the number of zeros within factions (where all the ties are supposed to be present in the ideal type) plus the number of ones in the non-diagonal blocks (ties between members of different factions, which are supposed to be absent in the ideal type). Since there are 49 total ties in our data, being wrong on the locations of 27 is not a terribly good fit. It is, however, the best we can do with four "factions."
The four factions are identified, and we note that two of them are individuals (10, 9), and one is a dyad (3,6).
The "blocked" or "grouped" adjacency matrix shows a picture of the solution. We can see that there is quite a lot of density "off the main diagonal" where there shouldn't be any. The final panel of the results reports the "block densities" as the number of ties that are present in blocks as proportions of all possible ties.
This approach corresponds nicely to the intuitive notion that the groups of a graph can be defined by a combination of local high density, and the presence of "structural holes" between some sets of actors and others. The picture then not only identifies actual or potential factions, but also tells us about the relations among the factions -- potential allies and enemies, in some cases.
The location of individuals in nets can also be thought of in terms of cliques or sub-groups. Certain individuals may act as "bridges" among groups, others may be isolates; some actors may be cosmopolitans, and others locals in terms of their group affiliations. Such variation in the ways that individuals are connected to groups or cliques can be quite consequential for their behavior as individuals.
In this section we have briefly reviewed some of the most important definitions of "sub-groups" or "cliques." and examined the results of applying these definitions to a set of data. We have seen that different definitions of what a clique is can give rather different pictures of the same reality.
1. Can you explain the term "maximal complete sub-graph?"
2. How do N-cliques and N-clans "relax" the definition of a clique?
3. Give an example of when it might be more useful to use a N-clique or N-clan approach instead of a strict clique.
4. How do K-plexes and K-cores "relax" the definition of a clique?
5. Give and example of when it might be more useful to us a K-plex or K-core approach instead of a strict clique.
6. What is a component of a graph?
7. How does the idea of a "block" relax the strict definition of a component?
8. Are there any cut points in the "star" network? in the "line" network? in the "circle" network?
9. How does the idea of a lambda set relax the strict definintion of a component?
10. Are there any "bridges" in a strict hierarchy network?
Application questions
1. Think of the readings from the first part of the course. Which studies used the ideas of group sub-structures? What kinds of approaches were used: cliques, clans, plexes, etc.?
2. Try to apply the notion of group sub-structures at different levels of analysis. Are there sub-structures within the kinship group of which you are a part? How is the population of Riverside divided into sub-structures? Are there sub-structures in the population of Universities in the United States? Are the nations in the world system divided into sub-structures in some way?
3. How might the lives of persons who are "cut points" be affected by having this kind of a structural position? Can you think of an example?
4. Can you think of a real-world (or literary) example of a population with sub-structures? How might the sub-structures in your real world case be described using the formal concepts (are the sub structures "clans" or "factions" etc.).